SOUTH CAROLINA 6TH GRADE SCIENCE
  • Home
    • MEET THE AUTHORS
  • SEP's
    • LAB SAFETY, VARIABLES & TOOLS
    • Learning the SEPs Viewing Guide
    • 6.S.1A.1 Practice 1: Asking Questions
    • 6.S.1A.2 Practice 2: Develop and Use Models
    • 6.S.1A.3 Practice 3: Planning & Carrying Out Investigations
    • 6.S.1A.4 Practice 4: Analyzing & Interpreting Data
    • 6.S.1A.5 Practice 5: Using Mathematics & Computational Thinking >
      • How to Solve Dimensional Analysis Problems
    • 6.S.1A.6 Practice 6: Constructing Explanations & Designing Solutions
    • 6.S.1A.7 Practice 7: Engaging In Argument From Evidence
    • 6.S.1A.8 Practice 8: Obtaining, Evaluation, & Communicating Information
    • 6.S.1B.1 Practice 9: Construct Devices or Design Solutions
  • ENERGY
    • 6.P.3A.1- FORMS OF ENERGY
    • 6.P.3A.2 TRANSFER BETWEEN KINETIC & POTENTIAL, LAW OF CONSERVATION OF ENERGY
    • 6.P.3A.3 ENERGY TRANSFER IN ELECTRICAL CIRCUITS
    • 6.P.3A.4 ELECTROMAGNETS, GENERATORS & ELECTRIC MOTORS
    • 6.P.3A.5 CONDUCTION, CONVECTION, RADIATION & HEAT TRANSFER
    • 6.P.3A.6 DESIGN & TEST MODELS TO INCREASE OR DECREASE HEAT TRANSFER BY CONDUCTION, CONVECTION & RADIATION
    • 6.P.3B.1 SIMPLE & COMPOUND/COMPLEX MACHINES
    • 6.P.3B.2 MACHINE EFFICIENCY, MECHANICAL ADVANTAGE & WORK
    • ENGINEERING DESIGN
    • ENERGY REVIEW ZOMBIE TURKEY-ENERGY UNIT REVIEW
    • PASS ENERGY UNIT STUDY GUIDES
  • WEATHER
    • WEATHER LABS
    • 6.E.2A.1 PROPERTIES OF THE ATMOSPHERE
    • 6.E.2A.2 HUMAN VS. NATURE'S IMPACT ON ATMOSPHERE
    • 6.E.2A.3 WATER CYCLE
    • 6.E.2B.1 INTERPRETING WEATHER MAPS, TOOLS & CLOUDS
    • 6.E.2B.2 AIR MASSES, PRESSURES & FRONTS
    • 6.E.2B.3 SOLAR ENERGY & CONVECTION'S IMPACT ON CLIMATE (GLOBAL WINDS, JET STREAM, OCEAN CURRENTS)
    • 6.E.2B.4 CHARACTERISTICS OF CLIMATE
    • PASS WEATHER UNIT STUDY GUIDES
  • PLANTS
    • 6.L.4A.1 CHARACTERISTICS OF LIFE
    • 6.L.4A.2 CLASSIFICATION STRUCTURE
    • 6.L.5A.1 HOW PROTIST (EUGLENA, PARAMECIUM & OMEBA) & FUNGI OBTAIN ENERGY
    • 6.L.5A.2 HOW FUNGI RESPOND TO EXTERNAL STIMULI
    • 6.L.5B.1 HOW VASCULAR/NONVASCULAR TRANSPORT FOOD/WATER
    • 6.L.5B.2 PHOTOSYNTHESIS, RESPIRATION & TRANSPIRATION
    • 6.L.5B.3 STRUCTURAL ADAPTATIONS/PROCESSES FLOWERING PLANTS USE FOR DEFENSE, SURVIVAL & REPRODUCTION >
      • GERMINATION
      • FLOWERS
    • 6.L.5B.4 HOW ENVIRONMENTAL CHANGES AFFECT GROWTH AND DEVELOPMENT OF FLOWERING PLANTS
    • 6.L.5B.5 PLANT RESPONSE TO EXTERNAL STIMULI
    • PLANT DOCTORS
    • PASS PLANT UNIT STUDY GUIDES
  • ANIMALS
    • 6.L.4A.1 CHARACTERISTICS OF LIFE
    • 6.L.4A.2 CLASSIFICATION STRUCTURE
    • 6.L.4B.2 STRUCTURAL ADAPTATIONS FOR DEFENSE, MOVEMENT & OBTAINING RESOURCES
    • 6.L.4B.1 COMMON CHARACTERISTICS OF VERTEBRATES/INVERTEBRATES
    • 6.L.4B.5 ENDOTHERMIC & ECTOTHERMIC
    • 6.L.4B.3 RESPONSE TO ENVIRONMENTAL STIMULI
    • 6.L.4B.4 CLASSIFY INNATE & LEARNED BEHAVIORS
    • ANIMAL BENCHMARK REVIEW
    • PASS ANIMAL UNIT STUDY GUIDES
  • SC PASS REVIEW
  • VIRTUAL LABS

Practice 4: Analyzing & Interpreting Data


Picture
>  After data has been collected, it must be analyzed in order to:
  • determine patterns
​    & relationships
  • communicate those results to others.

Possible Sources of Data


How To Gather Data

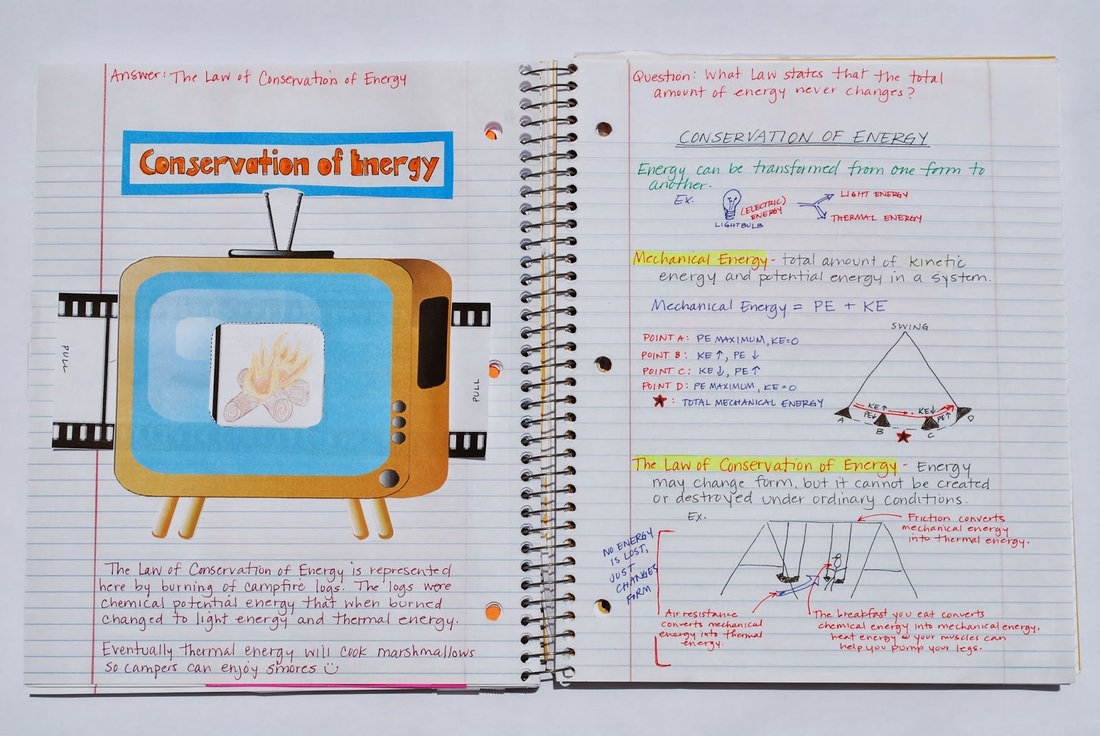
Science Journals

Science notebooks and journals may contain drawings, measurements,
numbers, words, and observations.
Picture

Guidelines for Charts

Tables allow organization and summary of data. A data table should be planned before the investigation starts. Consider the following:
  • purpose of the table
  • the kind and number of items to be included in the table
  • the number of times a measurement will be made
  • the units to be used
Data tables are often organized in columns and rows. 

Graphing Data


​>  Graphs can be used to visually summarize and make data accessible.

>  Graphs are visuals used to compare data.

>  Graphs show not only information but also relationships between the data.

​>  Different types of graphs show different types of information.


>> Use the Graphing Skills Gizmo from www.explorelearning.com to review & practice the basic components of each type of graph.<<
Citation: ExploreLearning Gizmos, Graphing Skills. © ExploreLearning.  


Defining Variables


>  Variables are factors that can affect the results of an experiment. Before an investigation begins, the variables that could affect the results must be identified.

​>  It should then be determined which
one variable to change or test and which conditions should be kept the same in the experiment. 
​
  • Independent (Manipulated) Variable - The variable that is being tested as the possible cause of the outcome that is being measured.
​
  • Dependent (Responding) Variable - The variable that is being measured as the results from the changes made to the independent variable (this making it dependent upon the other). 

Challenges of Data Collection & Analysis

You should be able to explain why results might be different even though the same investigation testing the same factors was being done by several groups. Investigations may yield varying results based on the following factors: 

Jedi Masters of this Practice Can...

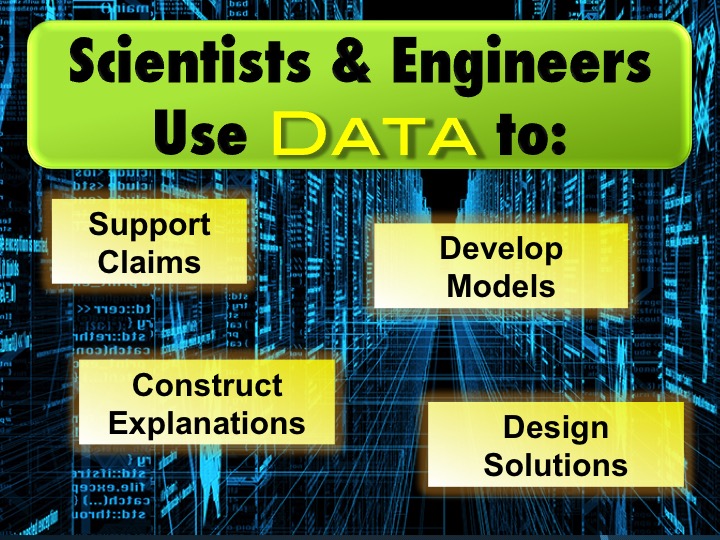
>  Use data as evidence to do the following:
         - support reasoning
         - support a claim
         - construction an explanation
         - evaluate a design or solution


>  Identify trends, patterns, and relationships within a data set.


>  Distinguish between causation and correlation


>  Use statistical practices in analyzing data.


>  Appropriately organize and represent data.


>  Determine whether or not the data supports predicted               outcomes. 
Powered by Create your own unique website with customizable templates.